Digital SAT · Math · Unit 3 · Problem Solving & Data
Lesson 3.4 · Mean, Median, Mode, Range & Spread
On the test: 2–3 questions a test — often “which statement compares…” with no arithmetic at all
Big idea. Two kinds of numbers describe a data set. CENTER — where the data sits: mean (the balance point), median (the middle value), mode (the most common). SPREAD — how scattered it is: range, interquartile range, standard deviation. Most SAT questions ask how one change (an outlier, a shift) moves each of them.
🎛 Move it · the live dot plot
Add and remove dots. Watch which measures move and which hold still.
Try: add a dot at 12. The mean (▲) jumps toward it; the median (green line) moves at most half a step. Pile dots in the middle: the SD bar shrinks.
- 1
📋 The question · SAT · May 2024 · Math 800 Book Q7
Masses (g) of 5 lemurs: 3,910; 3,910; 3,130; 3,950; 3,150. Mean mass?
(type the answer)
the question
May 2024: mean mass of 5 lemurs.
- 1
the idea
Frequency 4 means the value appears 4 times.
- 1
📋 The question · SAT · June 2024 · Math 800 Book Q30
175 compounds have mean boiling point 167°C; 50 of them have mean 327°C. Mean of the other 125?
(type the answer)
the question
June 2024: mean of the other 125?
- 1
📋 The question · SAT · March US 2023 · Math 800 Book Q5
Toronto snowfall (cm), 2002–2010: 114.9, 129.6, 134.9, 162.6, 32.4, 114.1, 216.5, 89.0, 45.6. Median?
- A)32.4
- B)114.9
- C)115.5
- D)184.1
sort
March US 2023 snowfall: the years are NOT in order of size — sort first.
- 1
mode
The tallest column of dots or the biggest frequency. There can be more than one.
🎛 Move it · the Box Plot Lab
Press “Next move” to build the box plot one move at a time. Then change the dots, switch to an even count, and add the outlier.
move 1 of 8 · The data, sorted
9 values on the number line: 3, 4, 5, 6, 7, 9, 11, 13, 16. A box plot is built from them in six moves.
min
3
Q₁
4.5
median
7
Q₃
12
max
16
IQR
7.5
Not on a box plot: the mean (here 8.22), how many values there are, and the exact values inside each section.
- 1
📋 The question · Gen Z Study · build it (odd count)
The data set is 3, 16, 5, 9, 4, 13, 7, 11, 6. What is the first quartile, ?
(type the answer)
what a box plot is
A box plot draws FIVE numbers of a data set — nothing else. We build them from these 9 values.
- 1
📋 The question · Gen Z Study · build it (even count)
The data set is 2, 3, 5, 6, 8, 9, 11, 13, 15, 18. What is the third quartile, ?
(type the answer)
sort
10 values — an even count.
- 1
📋 The question · SAT · May 2024 · Math 800 Book Q14
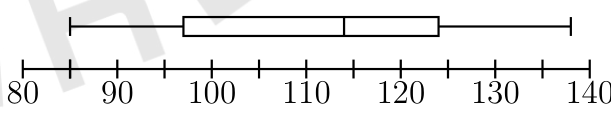
A box plot of units sold per day for 28 days. Minimum units sold per day?
(type the answer)
the whiskers
May 2024: the left whisker starts at 85, so the minimum is 85.
- 1
four sections
Each holds about 25 % of the values — that is what “quartile” means.
- 1
IQR
The width of the box: how spread out the MIDDLE half is.
- 1
📋 The question · Gen Z Study · compare two
Class A Class B The box plots summarize the test scores of class A and class B. Which statement must be true?
- A)Class A has the greater median
- B)Class B has the greater interquartile range
- C)Class A has the greater range
- D)Class B has the greater mean
center
Compare the LINES INSIDE the boxes. That statement must be true (A).
- 1
📋 The question · Gen Z Study · what it cannot tell
From the box plot alone, which can be determined? I. the median II. the mean III. the number of values
- A)I only
- B)I and II
- C)I and III
- D)I, II and III
it shows
Five numbers and anything made from them.
A store recorded the number of units sold per day for 28 days (box plot). What is the minimum number of units sold per day?
- 1
idea
The SAT never makes you compute it — only compare.
- 1
add a constant
Mean, median, mode all move by ; range and SD do NOT change (every distance stays the same).
- 1
📋 The question · SAT · May US 2024 · Math 800 Book Q23
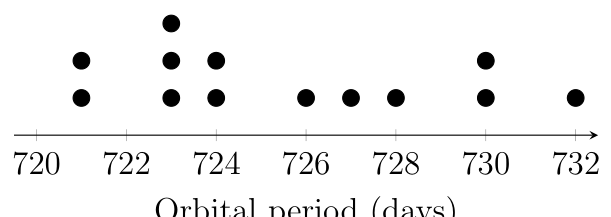
Orbital periods of 13 moons are shown. A moon with period 628 days is added (14 values). Which compares the means and medians?
- A)Mean equal, median equal
- B)Mean equal, median less
- C)Mean less, median less
- D)The mean of the new data set is less than the mean of the original, and the median of the new data set is equal to the median of the original.
the question
May US 2024: 13 moons, add one tiny value.
- 1
right tail
A few large values pull the mean up.
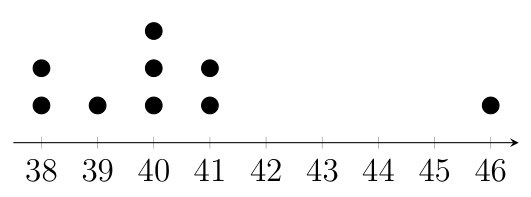
The dot plot shows 9 values with mean and median . The value 46 is removed to make 8 values with mean and median . Which statement best compares them?
Take with you
- ▸Mean = sum ÷ count; total = mean × count (use totals to combine or split groups).
- ▸Median: SORT, middle value (odd) or average of the two middles (even); count down a frequency table.
- ▸Mode = most frequent; range = max − min; IQR = Q₃ − Q₁ (the box).
- ▸Box plot = five numbers. Q₁ and Q₃ are the medians of the lower and upper halves; each section holds a quarter of the data (a long section = spread out, not more values); no mean, no count.
- ▸SD = typical distance from the mean: bunched → small, spread to the ends → large.
- ▸Adding a constant shifts the centre only; multiplying scales everything.
- ▸An outlier pulls the mean, barely the median. Right tail: mean > median.