Digital SAT · Math · Unit 3 · Problem Solving & Data
Lesson 3.5 · Scatterplots, Lines of Best Fit & Models
On the test: 1–3 questions a test — mostly “which equation best represents the line of best fit shown?”, read in seconds
Big idea. A scatterplot puts one dot for every pair (x, y). Its SHAPE tells a story: which way it goes, how tightly, straight or curved. A line of best fit summarizes a straight trend — its y-intercept and slope can be read straight off the graph, and it predicts. Most SAT questions are answered by three glances: where the line crosses the y-axis, which way it tilts, and how steeply.
🎛 Move it · the Scatter Lab
Move the two sliders until your line fits. Watch the gaps (residuals) and the misfit score; then compare with the best line. Try the curved data sets.
Your line: y = 2 + 0.5x · misfit (sum of squared residuals) = 59.59
Green gaps: the point is ABOVE the line (actual > predicted). Red: BELOW. The line of best fit balances them and keeps them small.
- 1
one dot = one data pair
Go across to , up to . The plot shows how tends to change as changes.
- 1
residual
The vertical gap from a point to the line. Above the line: positive (green). Below: negative (red).
- 1
📋 The question · SAT · March 2024 · Math 800 Book Q5
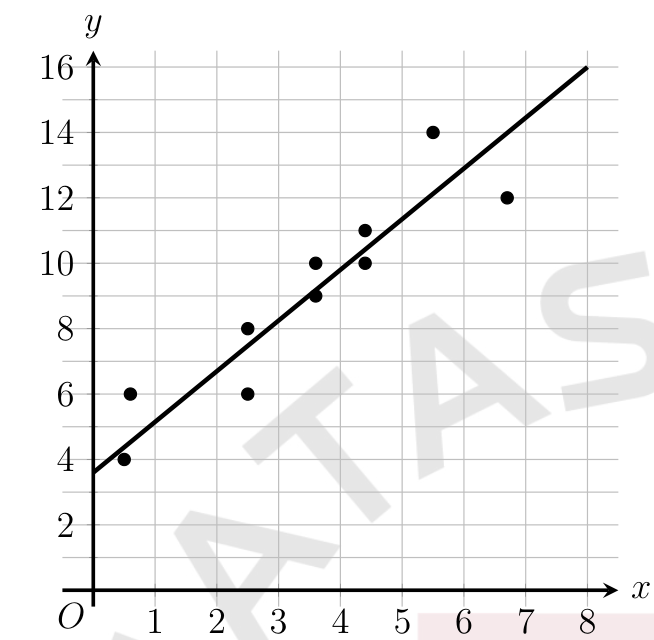
The scatterplot shows the relationship between two variables, and . A line of best fit is also shown. Which of the following equations best represents the line of best fit shown?
- A)
- B)
- C)
- D)
step 1 · the y-intercept
Where the LINE crosses the -axis. Options with or are out — keep A () and C ().
- 1
📋 The question · SAT · October 2024 · Math 800 Book Q8
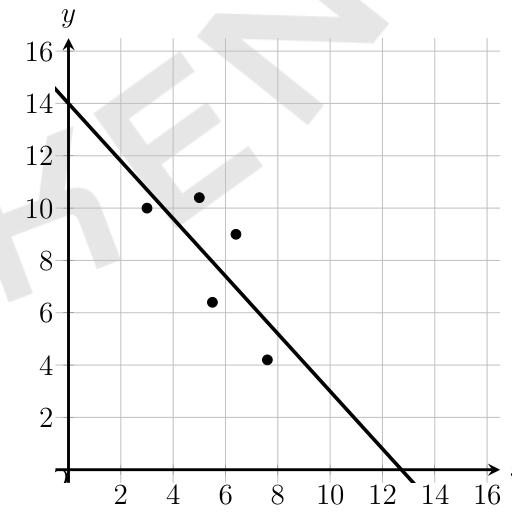
Which of the following is closest to the slope of this line of best fit?
- A)
- B)
- C)
- D)
pick two points ON THE LINE
October 2024: use where the line crosses the axes or grid corners — never the data dots (they are not on the line).
Fast lane · The 10-second method
Desmos move · In Bluebook’s Desmos
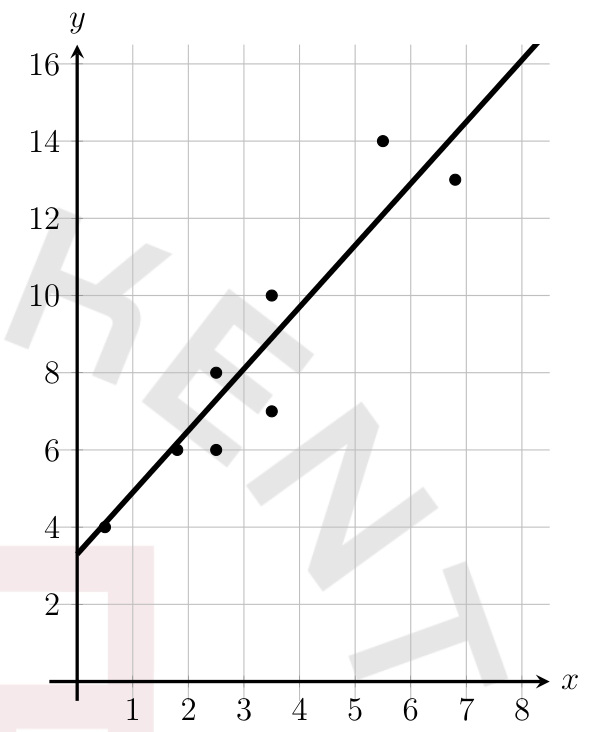
Which of the following equations best represents the line of best fit shown?
- 1
📋 The question · SAT · October US 2024 · Math 800 Book Q16
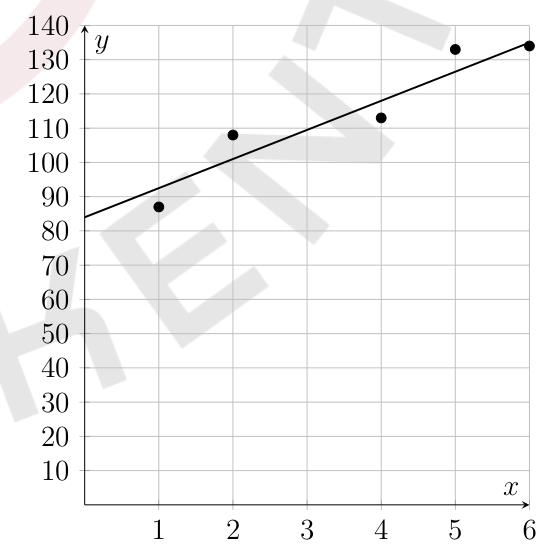
The scatterplot shows the body length, in centimeters (cm), of a New Zealand fur seal from an age of 1 to 6 years old. A line of best fit is also shown. For a New Zealand fur seal at an age of 3 years old, what is the body length, in centimeters, predicted by the line of best fit, to the nearest 10 cm?
(type the answer)
up to the line, across
October US 2024: from age 3 go up to the line (not to a dot), then across to the -axis: about 109 → 110 cm.
- 1
📋 The question · Gen Z Study · slope in context
The line of best fit models the height , in centimeters, of a plant weeks after it was planted. What is the best interpretation of 3.5 in this context?
- A)The plant’s height when it was planted
- B)The predicted increase in height, in centimeters, per week
- C)The number of weeks the plant grew
- D)The plant’s height after 3.5 weeks
the slope
3.5 is the predicted change in for each increase of 1 in : 3.5 cm more per week (B).
- 1
📋 The question · SAT · August US 2024 · Math 800 Book Q13
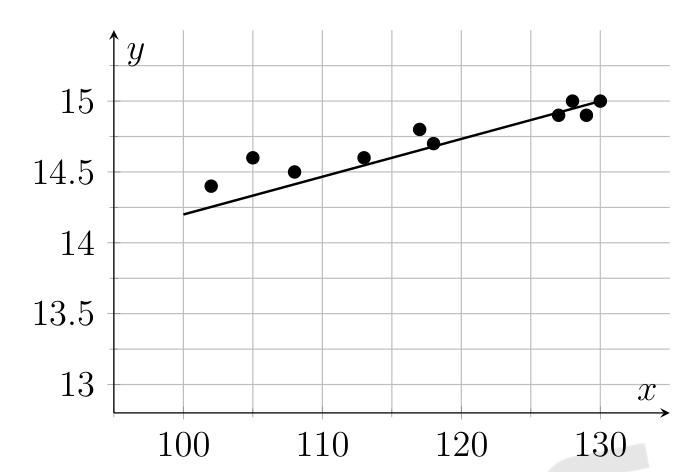
The scatterplot shows the relationship between two variables, and , for the data set P. A line of best fit for the data is also shown. Data set Q is created by adding 540 units to the value of for each data point from the data set P. Which of the following could be an equation of a line of best fit for the data set Q?
- A)
- B)
- C)
- D)
the line for P
August US 2024: from about 14.2 at to 15.0 at : slope .
- 1
📋 The question · Gen Z Study · interpolation vs extrapolation
A line of best fit was made from data for children aged 4 to 12. For which age is a prediction from the line LEAST reliable?
- A)5
- B)8
- C)11
- D)30
interpolation vs extrapolation
Predicting inside the data’s range is reasonable; far outside it, the trend may not hold. D.
- 1
📋 The question · SAT · March 2024 · Math 800 Book Q6
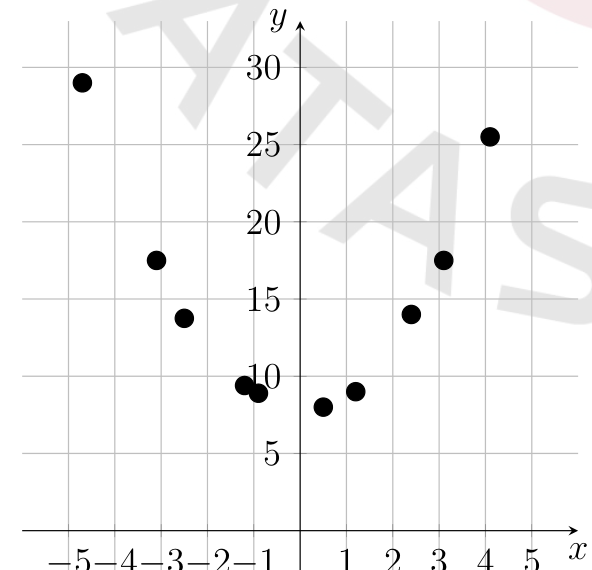
The scatterplot shows the relationship between two variables, and . Which of the equations is the most appropriate model for the data shown?
- A)
- B)
- C)
- D)
U-shape → quadratic
March 2024: lowest point near (0, 8): no shift left or right, lifted 8. B. ( would put the bottom at .)
- 1
📋 The question · SAT · August US 2023 · Math 800 Book Q3
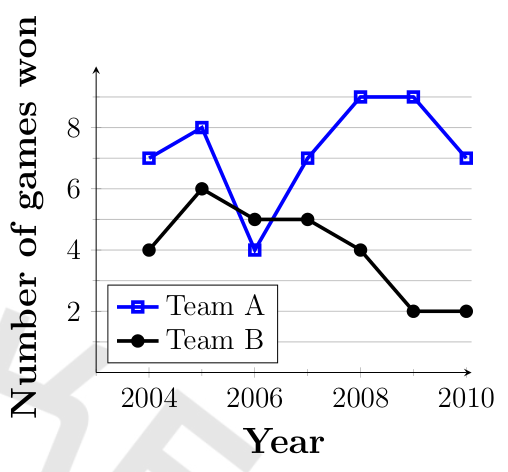
The line graphs show the number of games won by two football teams from 2004 to 2010. For how many of the years shown was the number of games won by Team A greater than the number of games won by Team B?
- A)1
- B)2
- C)6
- D)7
compare two lines
August US 2023: Team A is higher in 6 of the 7 years (not in 2006). C.
- 1
📋 The question · SAT · August 2024 · Math 800 Book Q12
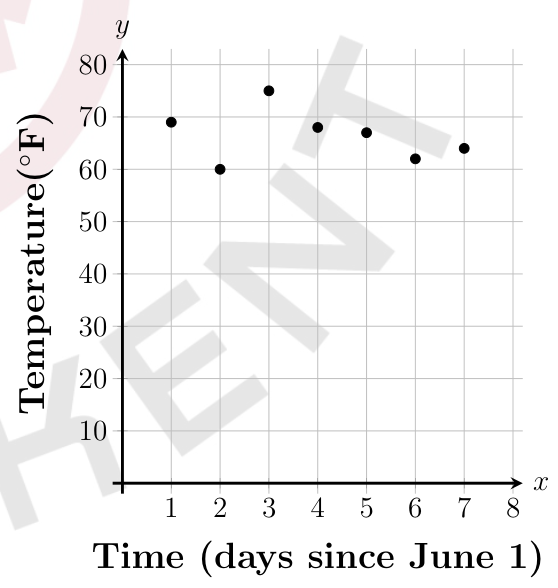
During which of the following time periods did the greatest increase in recorded temperature take place?
- A)From to
- B)From to
- C)From to
- D)From to
biggest rise between two neighbours
August 2024: compare the rises: 1→2 is a FALL, 5→6 a fall, 6→7 only +2. The steepest climb is from to : C.
- 1
📋 The question · SAT · August US 2023 · Math 800 Book Q22
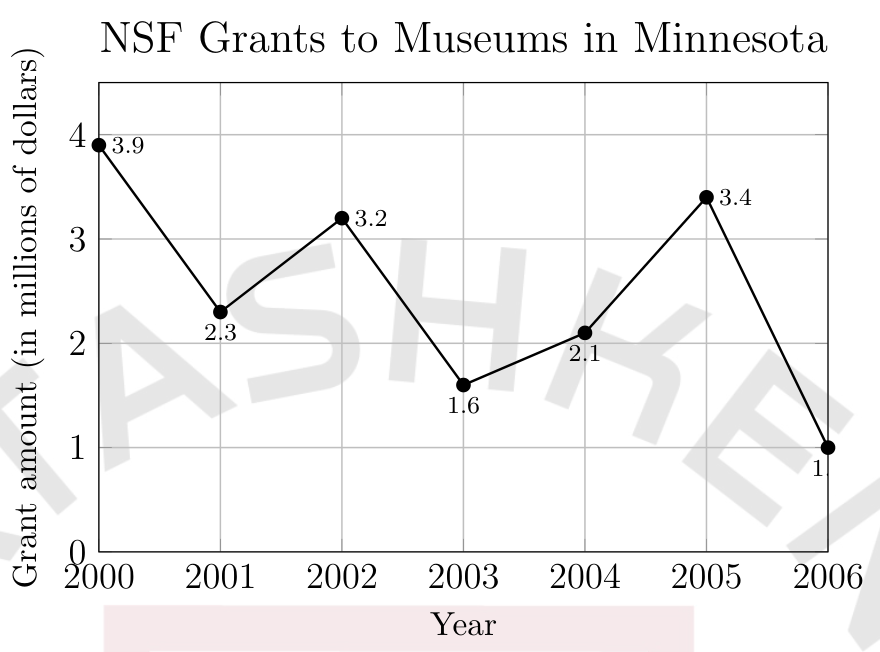
The same line graph (NSF grants to museums in Minnesota, 2000–2006). What is the approximate average rate of change of the amount, in millions of dollars per year, that the NSF granted to museums in Minnesota from 2000 to 2006?
- A)
- B)
- C)
- D)
only the ends matter
August US 2023: the ups and downs between do not count.
What is the approximate average rate of change of the amount, in millions of dollars per year, that the NSF granted to museums in Minnesota from 2000 to 2006?
Take with you
- ▸Read a scatterplot for direction (+ / − / none), form (straight / curved), strength (tight / loose) and outliers.
- ▸Line of best fit: through the middle of the cloud, residuals (actual − predicted) small and balanced.
- ▸“Which equation?” → y-intercept first, then the sign (rise/fall), then the size from two points ON THE LINE; mind the axis scales.
- ▸Predict by going up to the LINE; slope = change in y per 1 of x (with units), intercept = y at x = 0.
- ▸Adding a constant to every x keeps the slope and moves the intercept by −(slope × constant).
- ▸U-shape → quadratic, constant ratio / bending upward → exponential, straight → linear.
- ▸Line graphs: compare point by point; average rate of change uses only the two ends.
- ▸Do not trust a line far outside its data, and an association never proves a cause.